
Cadila - Analysis for Intraday and Swing Trading
Cadila is the stock that we are going to analyse today based on Open Interest and Change in Open Interest for swing as well as Intraday Trade. We also check the Trend Cycles of it. Before this, we have analyzed TCS : You can check here.
Cadila Option Front :
Cadila has given closing at 359.75 on 8th July 2020. Highest call open interest is at 400 strike price, followed by 370 and highest Open interest at put side is at 360 strike followed by 340.
Cadila has given closing at 359.75 on 8th July 2020. Highest call open interest is at 400 strike price, followed by 370 and highest Open interest at put side is at 360 strike followed by 340.
Trading Range Of Cadila
Now time to find out the trading range of the Cadila. For this purpose, we need to look for the highest call OI Row and Highest Put OI Row on the option chain of the Titan. Trading range seems to be 340 to 400.
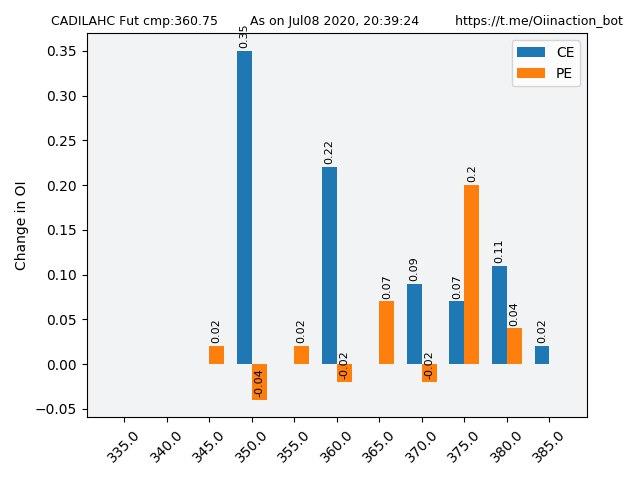
1. Highest Call at 400.
2. Highest Put at 360.
1. Pivot Strike at 360.

Highest call acts as the highest resistance and highest put will act as the highest support for the stocks.
Trend Cycles
| Cadila Trend Cycles |
Conclusion:
Cadila is near at very important support that is 360. If it sustains below 360 then some move towards 340 and 320 can be seen. And if able to sustain above the support at 360, some long can take it towards 400.
This may take 6 to 7 trading days to happen. In the last two days, Cadila has given long-long unwinding cycles. If we get another long then 400 will be on the cards otherwise 340 and 320 can be seen. These all depends on the pivot level 360 as it is the make or break level for the Cadila.
This may take 6 to 7 trading days to happen. In the last two days, Cadila has given long-long unwinding cycles. If we get another long then 400 will be on the cards otherwise 340 and 320 can be seen. These all depends on the pivot level 360 as it is the make or break level for the Cadila.
Disclaimer: The analysis has been prepared for informational and educational purposes only. It is not and should not be regarded as investment advice or as a recommendation regarding any particular security or course of action.
|


No comments: