Implied Volatility Trading Strategy :What Options Traders Need to Know
Ever wondered what's the enchanting force propelling rapid market swings or the calmness of an open sea? It's volatility. Join us in this post for real trading adventures, unveiling the magic of implied volatility and its role in crafting successful option trading strategies.
Unmasking the Mysteries of Volatility
Volatility is a term used in the world of finance to describe the degree of variation or fluctuation in the price of a financial instrument, such as a stock, currency, or commodity, over time. It measures the speed and extent of price changes, indicating how much and how quickly the market's price for an asset can shift.
High volatility suggests that an asset's price can change rapidly and dramatically, while low volatility indicates relatively stable and predictable price movements. Traders and investors often use volatility as a key factor in making decisions, especially in options trading, where it plays a significant role in pricing and risk assessment. It's a fundamental concept in financial markets, and understanding it is crucial for effective investment and trading strategies.
Volatility serves as a marker of market uncertainty. When volatility is high, it signifies heightened market unpredictability. In some cases, this uncertainty can lead to reduced trading volume and open interest in the market.
India Vix - The Volatility Index
We'll explore various types of volatility in a moment, but first, let's delve into India VIX. India VIX, also known as the Nifty Volatility Index or the Volatility Index for the stock market, provides a comprehensive view of volatility.
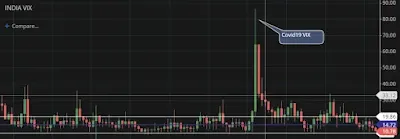
India VIX offers a comprehensive view of market volatility, with its behavior mirroring that of other volatility indices. The graph above illustrates this well.
Within the chart, you'll notice a horizontal line near 10, a point where the VIX frequently bounces. This marks the lower range of the VIX. Additionally, there's a level around 20, signaling the typical point at which the VIX begins to decline, representing the higher range of the Volatility Index. On specific occasions, India VIX surpasses the 20 mark.
Moreover, there's a distinctive blue horizontal line denoting the mean, positioned around 15. A noteworthy pattern emerges as you observe the VIX – it frequently circles around this mean, which falls between the higher and lower ranges of volatility. This demonstrates that VIX typically exhibits mean-reverting behavior.
A notable pattern emerges in Volatility
VIX frequently hovers around the mean. When volatility touches the lower range, it tends to gravitate towards the mean, and the same applies when it touches the higher range. We'll discuss instances when it goes beyond these ranges shortly.
From the graph above, several key points become evident:
- VIX has a defined higher range.
- VIX has a clear lower range.
- Most of the time, VIX moves within this range, signifying that volatility doesn't follow a trend; it tends to range.
- When VIX touches the higher range, it reverts toward the mean. The same holds true when it touches the lower range. In essence, volatility exhibits mean reversion.
- Neither higher volatility nor lower volatility endures for extended periods.
These key points are applicable to all types of volatility, including Implied Volatility and Historical Volatility.
India VIX and Nifty 50
A Volatility reading above 20 signifies a highly turbulent market, characterized by significant price swings. It's essential to note that Volatility measures swings, not direction. When the VIX hovers around 10, it indicates lower price swings in the market.
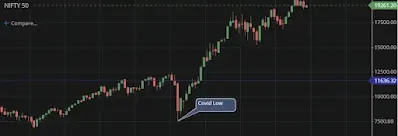
As previously discussed, Volatility doesn't indicate market direction, but it has an inverse relationship with the market. For instance, when India VIX reached an astonishing high above 80, the Nifty index signaled a bottom around 7500 during the COVID-19 pandemic. As VIX began to decline, we witnessed market rebounds.
Certain events trigger VIX surges, like elections or conflicts. For instance, during a national election, VIX can surge beyond 30, only to experience a post-election crash, given the mean-reverting nature of volatility.
COVID-19 was an extraordinary case where VIX skyrocketed beyond 80. During this unprecedented volatility, we observed substantial daily market swings, often in the range of 5 to 10 percent.
When India VIX hovers near 10, you'll notice that the Nifty's trading range is within 0.25 to 0.5%. However, as VIX begins to climb, the trading range expands, going from 0.5% to 1% and eventually reaching 1% to 2% when it approaches 20.
This insight into volatility levels is crucial for crafting effective Volatility Trading strategies.
What's the Deal with Implied Volatility?
Imagine you're planning a beach vacation. You check the weather forecast, and it predicts sunny skies all week. The forecasted weather is like implied volatility; it's a forward-looking estimate. In options, IV is like the market's weather forecast for a specific stock – it gauges how traders anticipate its future price fluctuations.
When IV is high, traders expect stormy weather – significant price swings. Conversely, low IV suggests a calm sea of stability. This metric plays a vital role in option pricing because it influences the cost of insurance against stock price movements.
Why Implied Volatility Takes Center Stage in Option Trading
IV: The Option Pricing Conductor
Imagine IV as the conductor of an orchestra, orchestrating the beautiful symphony of option pricing. It plays a crucial role in determining the price of options, and here's why it takes center stage.
Option prices are influenced by a quartet of Option Greeks – Delta, Gamma, Theta, and Vega. Let's focus on Vega, which specifically relates to volatility.
A higher Vega equates to greater volatility in options, resulting in higher premiums for those options. Conversely, a lower Vega indicates reduced volatility within options, translating to lower premiums required for option purchase.
When you buy options, you're essentially paying for the right to buy (call option) or sell (put option) a stock at a specific price (strike price) on or before a specific date (expiration date). The price you pay for this privilege is called the option premium.
The IV Influence on Premiums
Here's where IV steps into the spotlight. IV measures the expected price swings of a stock over a certain period. When IV is high, it indicates that the market anticipates significant price fluctuations – like a rollercoaster ride. In this scenario, option premiums get more expensive because you're paying extra for the potential wild price swings.
Conversely, when IV is low, it suggests that the market expects the stock to be as calm as a serene lake. In this case, option premiums become more affordable because there's less fear of turbulent price movements.
Implied Volatility and Option Trading Strategies
To understand why IV is such a big deal in option pricing, consider the following scenarios:
High IV, High Premiums: The Thrill Seeker
Think of high IV like an adrenaline rush – it's exciting, but it comes at a cost. When IV is soaring, it's like the market's way of saying, Hold on tight; we're in for a bumpy ride. Consequently, the premiums for both call and put options rise. This is where traders who anticipate significant price swings come to play.
For example, during earnings season, IV tends to spike as investors brace for the unpredictable reactions to company announcements. Traders looking to capitalize on this volatility will pay more for options, making it a thrilling but potentially expensive ride.
Low IV, Lower Premiums: The Calm Waters
When IV is low, it's like the market is in vacation mode – no storms on the horizon. Option premiums are more affordable because there's less fear of turbulent price changes.
Historical Volatility: The Rear-View Mirror
On the other hand, historical volatility is like checking the weather report after you've returned from your vacation. It's a look in the rear-view mirror, examining past stock price movements. HV quantifies how much a stock's price has changed over a set period, providing historical context.
Let's say you checked the weather records for your beach destination after your trip. If they show a history of frequent rain showers, that's like high historical volatility. If you see mostly sunshine, that's low historical volatility.
Why the Distinction Matters : IV vs Hiatorical Volatility
Understanding the contrast between IV and HV is essential because it impacts your option trading strategy. When IV is high, option premiums tend to be expensive because traders are paying extra for the potential stormy weather. In contrast, low IV results in cheaper options because the expectation is milder price movements.
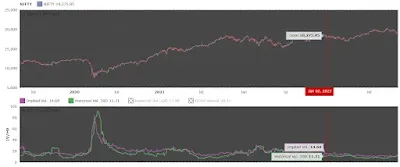
A common misconception is assuming that IV and HV should match. However, they often diverge. A stock's HV may be calm while its IV suggests a storm is brewing. This discrepancy can be a goldmine for options traders who know how to navigate it.
Navigating the IV-HV Divergence
Now that you know the difference between IV and HV, let's explore how you can navigate this divergence in your option trading strategy.
Strategy for High IV, Low HV
Picture this: IV is through the roof, but HV is as tranquil as a lake at dawn. In this scenario, traders anticipate significant price swings (IV), but recent stock movements have been calm (HV). What to do?
Consider selling options. When IV is high, option premiums are juicier, making it an opportune time to write covered calls or cash-secured puts. These strategies allow you to collect the extra premium that others are willing to pay for insurance against turbulent price changes.
Strategy for High IV, High HV
Sometimes both IV and HV are soaring like kites on a windy day. This indicates an environment of anticipated and historical price turbulence. In this case, consider employing strategies that benefit from price movements.
Iron condors and straddles, for instance, are options strategies designed to profit from significant price fluctuations. These strategies involve both buying and selling options to take advantage of volatility.
Strategy for Low IV, High HV
When IV is in a state of tranquility (low), but HV is telling tales of past turbulence (high), it's like expecting calm seas after a string of storms. It's a paradoxical situation.
In such circumstances, consider long straddles or strangles. These strategies involve purchasing both call and put options with the same strike prices and expiration dates. They can provide a cost-effective way to capitalize on sudden price swings when the market least expects them.
Balancing Act for IV
IV Guides Your Strategy Choice
Your trading strategy isn't just a roll of the dice; it's a calculated decision based on market conditions. If IV is high, you might opt for strategies that take advantage of expected price swings, like straddles or strangles. If IV is low, you might lean towards income-generating strategies, such as covered calls. It also tests your ability to analyze the market.
IV Helps Manage Risk
Trading isn't just about making money; it's also about managing risk. IV can be your trusted sidekick in this endeavor. When IV is high, it can signal potential market turbulence, prompting you to implement risk management strategies like adjusting position sizes or setting stop-loss orders.
IV Timing is Everything
Being aware of IV trends is like having a crystal ball for your trading decisions. By tracking IV changes, you can anticipate when option premiums might become more or less expensive. This insight can help you time your trades for maximum benefit.
In the world of option trading, implied volatility is the master of ceremonies. It takes center stage because it influences option prices, guides your strategy choices, helps you manage risk, and provides valuable timing insights.
Frequently Asked Questions
What is implied volatility, and how does it differ from historical volatility?
Implied volatility (IV) is a forward-looking estimate of price fluctuations, while historical volatility (HV) measures past price movements. IV reflects market expectations, whereas HV is based on historical data.
How does implied volatility impact option pricing?
Implied volatility plays a significant role in option pricing. When IV is high, option premiums increase, making options more expensive. Conversely, low IV results in cheaper options.
What are some common option trading strategies based on implied volatility?
Options traders use strategies like straddles, strangles, and iron condors to capitalize on high implied volatility. Covered calls and cash-secured puts are popular for low IV environments.
How can traders manage risk in high implied volatility situations?
Traders can employ risk management strategies like setting stop-loss orders and adjusting position sizes to mitigate risk during high IV periods.
Are there specific events or factors that can cause implied volatility to surge?
Yes, events like earnings reports, elections, and economic crises can lead to spikes in implied volatility as uncertainty and market turbulence increase.
How does implied volatility affect the Nifty or stock market trading range?
When India VIX (a measure of implied volatility) is low, the Nifty's trading range tends to be narrower. As IV increases, the trading range expands.
Can implied volatility be a predictor of market direction?
Implied volatility itself doesn't indicate market direction, but it can provide insights into market uncertainty and the potential for significant price swings.
Are there any exceptions to the relationship between implied volatility and option premiums?
Yes, during unusual market events, implied volatility can become detached from option premiums, leading to unique trading opportunities.
How can I use implied volatility in my trading strategy?
Traders can incorporate implied volatility by selecting appropriate strategies based on the current IV environment, like straddles for high IV or covered calls for low IV.
Can you provide examples of real-life cases where implied volatility impacted trading decisions?
Certainly, we've discussed real-life case studies in the blog, showcasing how traders used implied volatility to make informed trading decisions.


No comments: