
Nifty and Bank Nifty Analysis for 2nd July 2020
Nifty witnessed a buying interest throughout the session that helped nifty to move towards 10450 level.
Bank Nifty opened on a flat note but witnessed strong buying momentum that extend its gains towards 22,000 level.
Let’s check the data and do the analysis for Bank Nifty and Nifty for 2nd July 2020 based on Open Interest, Change in OI, PCR, Max pain and Trend Cycles.
Bank Nifty Option Front
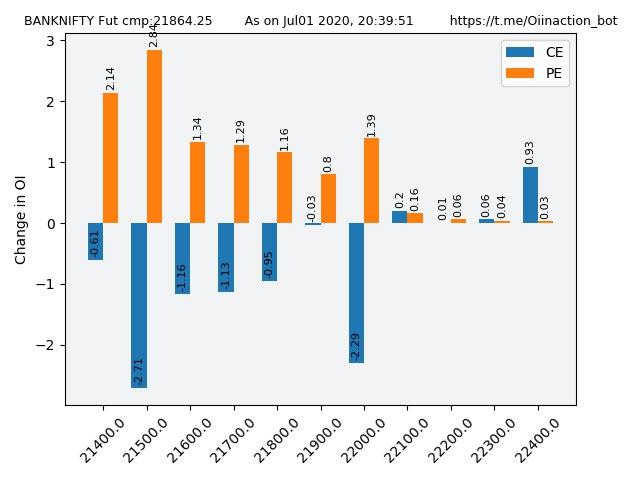
Bank Nifty has given closing at 21977.60 on spot on 1st July 2020. On the options front, maximum Put open interest was at 21,500 followed by 20,500 levels, while maximum Call OI was at 22,500 followed by 23,000 levels. The OI positions are scattered at various strike rates, indicates the volatility can remain in the market. A good put addition has been seen around the ATM strike.
Trading Range Of Bank Nifty
Now time to find out the trading range of the bank nifty. Trading Range is a general range between the highest call strike and highest put strike. To find the range, we need to look for the highest call OI Row and Highest Put OI Row on the option chain of the Bank Nifty. Trading range seems to be 21000 to 23000.

1. Highest Call at 22,500.
2. Highest Put at 20,500.
3. Pivot Level at 22,000.
Highest call acts as the highest resistance and highest put acts as the highest support for the Nifty and bank nifty. Pivot level is the level that bulls and bears don’t want to let it go easily. Tug of the war goes around the pivot level between bulls and bears generally.
Trading Range Of Nifty
Nifty has given closing at 10430.05 at spot on 1st July, 2020. In options front, maximum Put open interest stood at 10,300 level followed by 10,000, while maximum Call OI was at 10,500 followed by 10,600 levels. Call unwinding was seen at 10,300 followed by 10,400 levels, while there was meaningful Put writing at 10,300 followed by 10,400 levels. Options data suggested a shift in trading range between 10,300 and 10,600 levels.

1. Highest Call at 10500.
2. Highest Put at 10,300.
3. Pivot Level at 10,400.
3. Pivot Level at 10,400.

India Vix
India VIX moved down 3.44 per cent to 28.11 level. A gradual decline in volatility suggests an overall bullish stance and emergence of multiple supports at every small declines.
It is sustaining above the maximum on Box Plot into outlier data on the daily scale and thus volatile swings may continue in the coming days. If you wonder what Box Plot is and how it works, you can check here details.
Derivative Data
Symbol
|
Pre. Max Pain
|
PCR (OI)
| |
Bank Nifty
|
21600
|
21400
|
1.07
|
Nifty
|
10400
|
10300
|
1.43
|
Remarks
| |||
Trend Cycles (EOD)
| Bank Nifty Trend Cycles |
| Nifty Trend Cycles |
Conclusion
The writers have been shifted their position up, indicates the strength in indices. Put writers are at the driving sheet as of now. Max Pain strike has been shifted up that also support the bullish sentiment.
Open Interest Images are generated by the Telegram Bot: OIinAction. You can also join it and can generate OI images for free.
Disclaimer: The analysis has been prepared for informational and educational purposes only. It is not and should not be regarded as investment advice or as a recommendation regarding any particular security or course of action.
Recommended Read:

No comments: